Global Urban Economic Bubbles
 By Parag Khanna
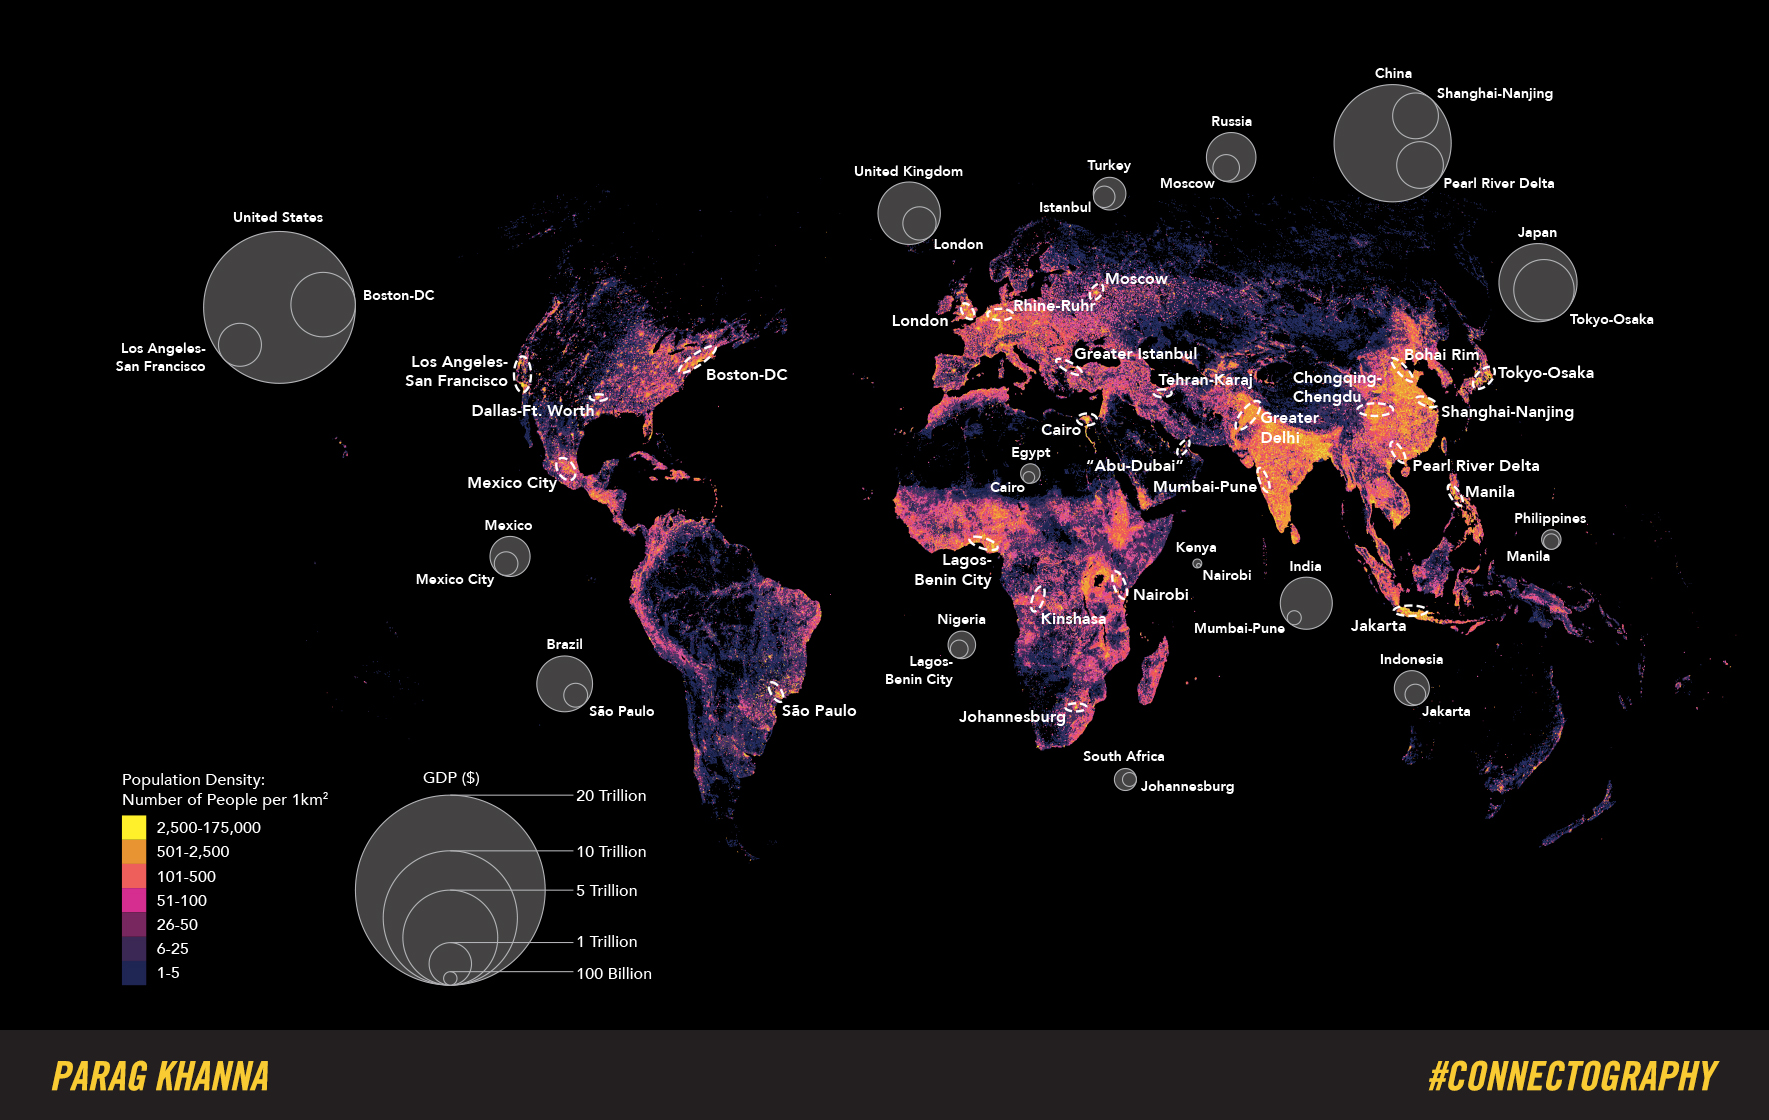
Cities have become the world’s dominant economic and demographic clusters. This map from Connectography shows the distribution of the entire world’s population, with yellow representing the most dense areas. These zones are not surprisingly where you find the dashed ovals that represent the world’s burgeoning mega-cities. Whereas most maps show cities as equally sized black dots, in fact megacities are growing so large that the urban surface area is expected to triple by 2050. Megacities are also growing in their economic gravity, both at home and internationally. Within many emerging markets such as Brazil, Turkey, Russia and Indonesia, the leading commercial hub or financial center accounts for at least one-third or more of national GDP. In the UK, London accounts for almost half Britain’s GDP. And in America, the Boston-NY-Washington corridor and greater Los Angeles together combine for about one-third of America’s GDP. This map of the world’s three dozen mega-cities therefore tells us much more about where the world’s people are and money is than conventional maps of 200 separate countries.
See more maps from Connectography and order the book here.